
Synthetic data: The infrastructure for the European Health Data Space
Why synthetic data represents a technological key to enable the secondary use of clinical data in Italian healthcare and accelerate medical research today.
Is synthetic data as good as real data?
Artificial intelligence (AI) is revolutionizing all aspects of our lives. Unfortunately, over 85% of AI projects never make it to the production phase 1. This is due to their reliance on large quantities of data. Organizations must have access to such data and ensure that they are clean, complete, and secure. This is not only costly 2, but also time-consuming: AI projects take nine months to complete on average 3.
Synthetic data technology is garnering attention as the key enabler for wide and effortless AI adoption. Synthetic data is not gathered through traditional empirical means, but is instead generated algorithmically. As such, an SD record cannot be linked to any real-world person.
In a previous blog, we explained how advanced generative AI techniques create synthetic datasets with an unassailable degree of realism. Such sets preserve all the information of real datasets they are modeled after, but are void of sensitive information. As such, SD can freely and rapidly be exchanged and analyzed. It can also augment datasets with underrepresented groups, yielding complete and bias-free datasets. SD overcomes the core obstacles to AI innovation in healthcare by reconciling data privacy and utility.
A common question that arises is how we can be sure that such synthetic data is “just as good” as real data. In this blog, we approach this question from three perspectives. Firstly, we provide an intuitive thought experiment that illustrates how synthetic data can have real analytic value. Secondly, we look at how well statistically relevant properties are preserved in synthetic data. Thirdly, we explain a method used by scientists to measure effectiveness of synthetic datasets in training AI systems.
A small thought experiment illustrates that synthetic data can be highly realistic. Suppose you want to create an artificial dataset for some group of people. You did research and have documented a lot of properties of this population. For example, you know that the female-male ratio of the population is equal. Furthermore, you know that roughly one in six people have blue eyes, while the others have brown eyes.
To create the data of an artificial person, you now do a small experiment: first, you flip a coin. If it lands on heads, you mark down “female”. If it lands on tails, you mark down “male”. Next, you roll a die. If it lands on the face with six eyes (a chance of 1/6), you mark down “blue eyes”. If it lands on any other face (1, 2, 3, 4 or 5, a chance of 5/6), you mark down “brown eyes”.
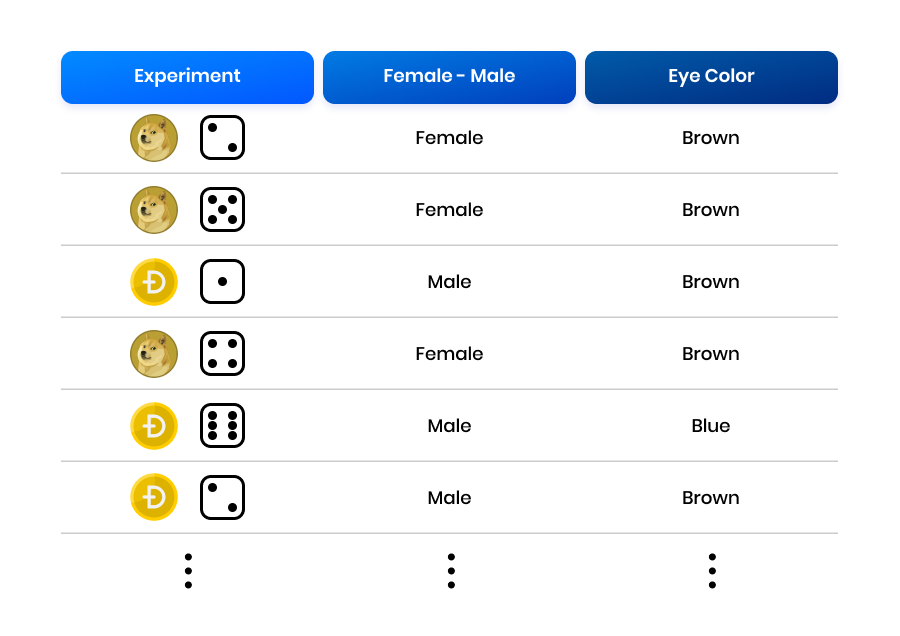 An experiment to create a simple synthetic dataset.
If you repeat this experiment many times, you obtain an entirely synthetic population that has all the statistical and mathematical properties of the real population (by a theorem called “the law of large numbers”). Yet, none of the records you create correspond to individuals in the real population.
Generative AI operates in a similar, though obviously more sophisticated fashion. The thought experiment requires advanced prior knowledge about the population. When using generative AI, no prior knowledge is needed: all relevant patterns are extracted directly from the data by the technology. These patterns are far beyond human comprehension, meaning that the realism of the synthetic data is unparalleled. Anomalies, statistical and causal dependencies, and hidden patterns are all replicated directly and effortlessly.
The degree to which synthetic datasets preserve statistical patterns is measured through various methods.
Comparing marginal distributions. In practice, datasets almost always involve a large number of attributes, that is: properties of people. For example, a database of a bank contains clients’ ages, genders, education level, incomes, savings, average monthly spending, and more. If we consider just a single attribute, ignoring all others, we obtain a marginal distribution. For example, in bank data, we can inspect just the distribution of clients’ ages, ignoring the other properties like gender, education level, etc.
If synthetic data accurately mirror the statistically relevant structure of a real dataset, then its marginal distributions should be roughly similar to the marginal distributions of the real dataset. This can often be verified visually in graphs and charts. Traditional statistical tests for assessing the similarity of two distributions can also be applied, such as Student’s t-test.
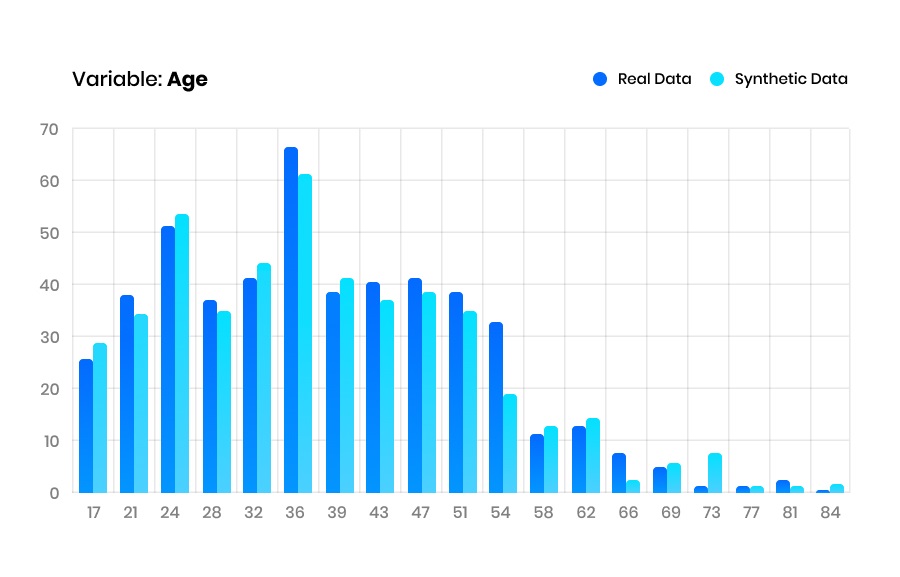 The real and synthetic marginal distributions of the age variable. It is visually clear that these distributions are very similar.
Comparing Correlation Matrices. The multiple attributes of a dataset affect each other in intricate ways. For example, in a dataset of a bank’s clients, age and education level likely correlate to income: higher educated people with more work experience likely earn more than their less experienced, lower educated counterparts.
For analytic applications, synthetic data should accurately mimic these correlations. Luckily, correlations can easily be visualized in so-called heatmaps (see the image below). It is then possible to visually inspect the similarity between a real and a synthetic correlation matrix. There is also a conventional statistical way to measure the similarity between correlation matrices: the pairwise correlation difference 4. This measure provides a quantitative, easy to interpret overview of how well correlations are preserved in a synthetic dataset.
 Correlation heatmaps of a real and a synthetic dataset. Each row and each column in a heatmap represents one attribute. The darker the shade of a grid, the stronger the correlation between its row-attribute and its column-attribute. Similarity in structure between the real and synthetic heatmaps therefore indicates that the synthetic dataset has preserved the correlations between the attributes very well.
Synthetic data is often invoked to train predictive AI models, removing the need to use sensitive real data. For example, a banker may want to predict whether a client is a credit risk based on their attributes (age, gender, education level, etc.). Naturally, industry and academia are therefore interested in measuring synthetic data effectiveness in this context: are predictions of models trained on synthetic data as good as those of models trained on real data? To answer this question, they developed a method called model compatibility 4.
In our example, an AI model is a set of mathematical rules that takes client attributes and converts it to a prediction. Model compatibility is essentially comparing an AI model trained on synthetic data to a model trained on real data. If the predictions of both models are equally valid, then the synthetic data is suitable for AI development.
In most (supervised) AI projects, the real dataset is divided into two parts: the training set (typically around 80% of the dataset) and the test set (the remaining data). The training set is used to build predictive AI models. Subsequently, the test set is used to assess whether the model’s predictions are accurate.
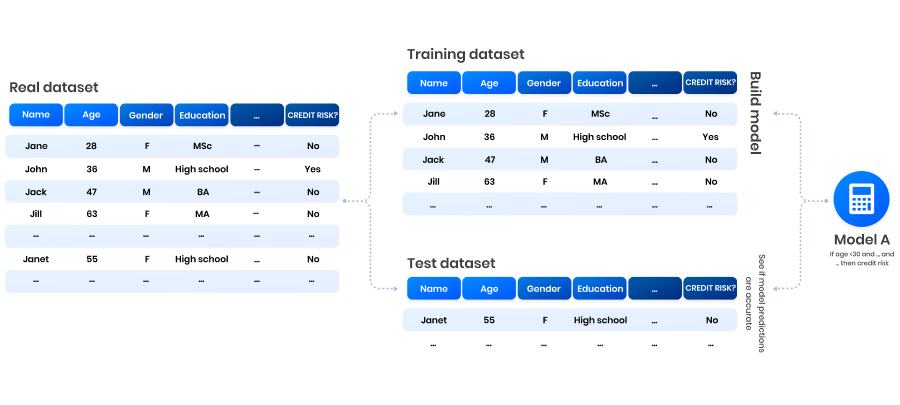 Building and testing a model on real data.
In our example, the banker’s training and test data document who is and is not a credit risk. Thus, when applying the model to the test data, verifying its accuracy is easy: the banker can simply compare the model’s prediction “John is a credit risk” to John’s actual credit risk status. In this way, a model’s performance is evaluated based on the number of correct and incorrect predictions. A good model can then be used to assess new clients, of whom the credit risk status is not known.
When applying model compatibility, the training set is further used to construct synthetic data. A second AI model is then built using the synthetic data. Thus, we obtain two models: one built using the training set and one built using the synthetic dataset.
By applying both models to the test set, we can see if their predictions are equally accurate. The result can be expressed as a percentage: Suppose the model built on real data predicted 98% of test data records accurately. Suppose further that the model built on synthetic data predicted 95% of test data records accurately. Then we have a model compatibility of (95%/98%)✕100% = 96.9%.
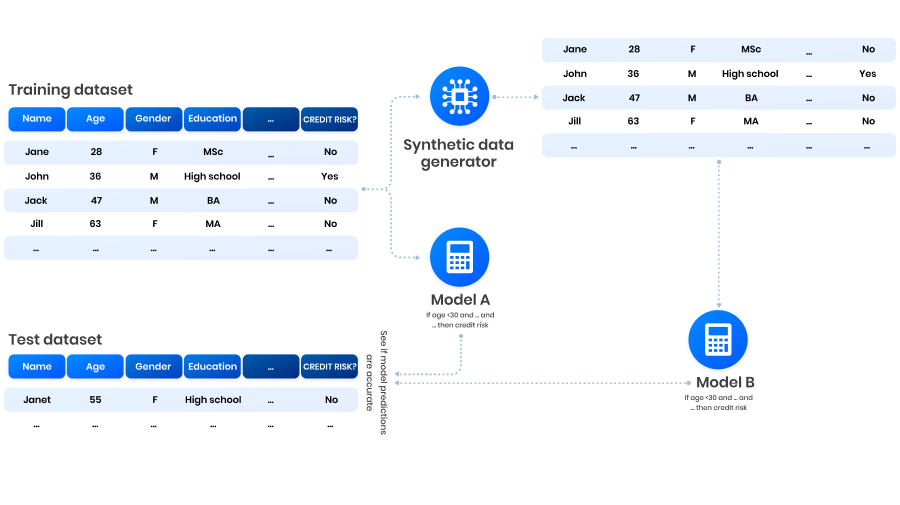 Model compatibility: we test both a model built on real training data (“Model A”) and one built on synthetic data (“Model B”) on a real test set. We can then compare their performances.
A common question that often arises is how we can be sure that synthetic data is “just as good” as real data. We started by making a thought experiment that illustrates intuitively how synthetic data is built with real analytical value.
Secondly, we looked at how well statistical properties are preserved in synthetic data. We explained two methods used for this aim: comparing marginal distributions and comparing correlation matrices. The former consists of comparing real and synthetic distributions of individual attributes. The latter consists of evaluating how well correlations between attributes are preserved in a synthetic dataset.
Finally, we explain model compatibility, a scientific method used to measure the effectiveness of synthetic datasets in training AI systems. This method compares an AI model trained on synthetic data to a model trained on real data. If the predictions of both models are equally valid, then the synthetic data is suitable for AI development.
Find more about our synthetic data use cases in our blog!
Van Der Meulen, R., (2018). Gartner Says Nearly Half of CIOs Are Planning to Deploy Artificial Intelligence. ↩
Grande, D., Machado, J., Petzold, B. and Roth, M., (2020). Reducing data costs without jeopardizing growth. McKinsey Digital. ↩
Rimol, M., (2021). Gartner Identifies Four Trends Driving Near-Term Artificial Intelligence Innovation. ↩
Panfilo, D., (2022) Generating Privacy-Compliant, Utility-Preserving Synthetic Tabular and Relational Datasets Through Deep Learning. University of Trieste. ↩ ↩2
Why synthetic data represents a technological key to enable the secondary use of clinical data in Italian healthcare and accelerate medical research today.

How synthetic data is becoming the foundation for clinical evidence generation and specialized AI development

Synthetic data is not just a privacy tool. It is the foundation of a new healthcare data infrastructure—one that makes data usable at scale.
What we look for
Beyond your technical background, we look for:
What we offer
💡 Growth & Impact: join a fast-growing company where you’ll lead strategic projects, shape solutions and see the tangible impact of your work
🌴 Flexibility & Wellbeing: hybrid or fully remote work, ticket restaurant and health insurance
🤝 Collaborative Culture: work in autonomous teams with highly talented colleagues, in a supportive, innovative and ethical environment
How to apply
To apply, please send your CV and a motivation letter to [email protected], with the subject “Spontaneous Application - [Your Area of Expertise]”.
Aindo is an Equal Opportunity-Affirmative Action Employer – Minority / Female / Disability / Veteran / Gender Identity / Sexual Orientation / Age.