
Synthetic data: The infrastructure for the European Health Data Space
Why synthetic data represents a technological key to enable the secondary use of clinical data in Italian healthcare and accelerate medical research today.
An overview of Synthetic Relational Data
Synthetic data technology is taking the world by storm. It has become indispensable in applications such as data completion, privacy-protected data exchange, software testing and more. Originally conceived for the generation of synthetic images, the technology is nowadays just as often applied to organizational data stored in tables.
To fully help society embrace the power of artificial intelligence (AI), reliable synthetic relational data is needed. Luckily, Aindo makes this readily available, combining revolutionary, patented 1 technology with an effortless user experience. In this blog, we explain how our unique approach works.
In a previous blog, we explained how in relational databases, data is distributed over multiple related tables. Each table contains information about a different aspect of the same problem. For example, consider a public healthcare dataset in which patient visits to clinics are documented. This dataset can consist of multiple tables:
Identification numbers (IDs) are used to match data in one table to that of another. In the visit table, patient and clinic IDs are documented for every visit. In this way, each visit is linked to the involved patient without the need to replicate all their data for every single visit.
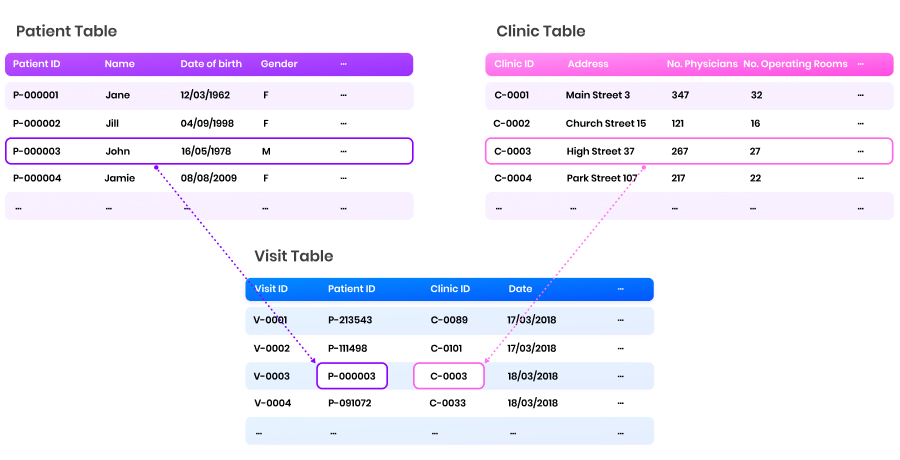 By documenting identifiers, patients and clinics are linked to visits without duplicating a large number of columns
Generating realistic synthetic relational data is challenging: not only does each individual table have to be replicated accurately, the relations between tables also have to be replicated.
The most common approach to creating synthetic relational data is through a technique called flattening. Essentially, this means merging the various tables. As such, an individual patient’s records are duplicated for all their visits.
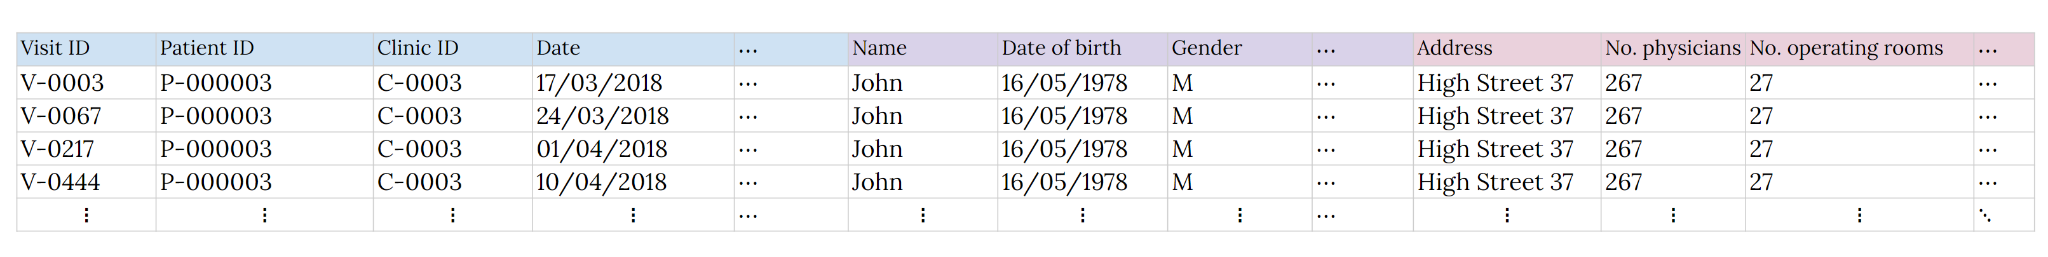 A flattened table in the patient-clinic visits example. Note how John’s and the clinic’s information have to be duplicated for all his visits.
While occasionally successful, flattening has four major shortcomings:
The rows in flattened tables are not independent and identically distributed. In a previous post, we mentioned that data has to be of a suitable format for synthetic data technology to be applicable. Among other conditions, rows in the dataset have to be independent and identically distributed (i.i.d.).
Flattened tables are not i.i.d.: John requires constant care and visits the clinic relatively frequently. Other patients may rarely visit clinics. Thus, the probability that a randomly selected record contains John’s data is large compared to records of others: the distribution is not identically distributed.
Connections between entities in different tables are not explored. In our example, John always visits the clinic at the High Street. There may be a reason for this: perhaps, this clinic is specialized in John’s specific medical condition. If this is the case, he may have hidden connections to other patients that visit this clinic. For example, unknown risk factors that an AI algorithm could detect. In flattening, links are completely removed and such hidden patterns can therefore not be explored.
Flattening does not scale to relational databases with highly complex interconnections. In the hospital visits example, there are only three tables, connected through two identifiers. In practice, relational databases often contain many more tables, connected in highly intricate manners. Flattening becomes challenging in these cases, as not all structures can be preserved.
Redundant information leads to long computation times. In the flattened table in our example, John’s personal information was copied at least four times. All this information has to be processed for synthetic data generation. These redundancies are inefficient, as large tables require long computation times.
Aindo’s research team is the first to overcome the challenge of generating realistic synthetic relational data at scale. To do so, we leveraged the power of a field of mathematics called graph theory.
Simply put, graphs are mathematical structures that can be represented as dots (“nodes” or “vertices”) connected by lines (“edges” or “arcs”). Think of graphs as a social network: each person is a node. Two people are connected by an edge if they are acquainted.
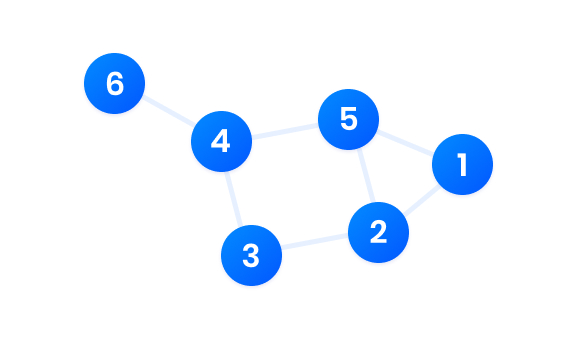 A graph with six nodes and seven edges.
Nodes in graphs can store information and edges say something about how this information is or gets distributed. When thought of as social networks, information in nodes can be personal properties, like age, gender and hobbies. Two people are then more likely to be connected if they share such properties, as they are in a peer group or cohort.
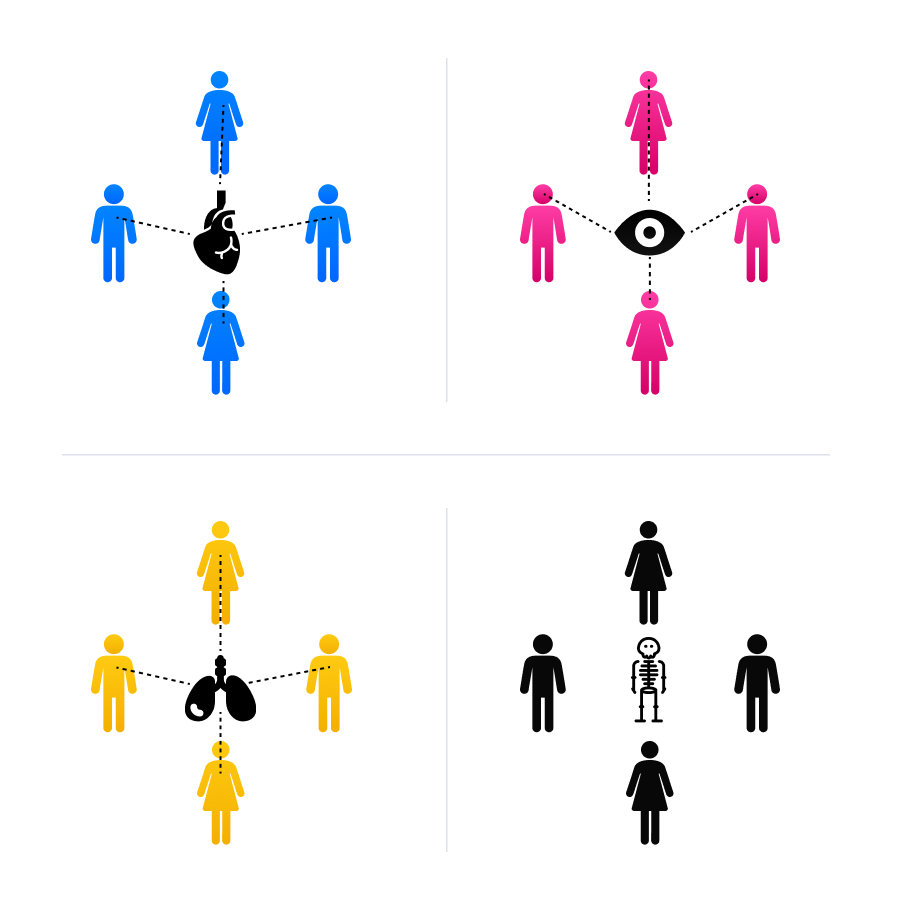 Patients form peer groups: the blue patients visit a clinic specialized in cardiovascular diseases regularly; the pink patients visit an eye-care specialist specialists regularly; and so on. Graph structures reveal peer groups through strong connectivity.
In our healthcare example, we do not want to leverage only John’s information. We also want to use the knowledge that he is in a cohort of patients who frequently visit a clinic specialized in cardiovascular diseases. We can then use general information about this cohort to make better prognostic, diagnostic and treatment decisions.
Graph neural networks form a machine learning framework developed for machine learning with graph structures. The strength of this framework is that it can infer properties of individuals as well as generalized properties of cohorts.
The crux of graph neural networks is message passing. This is the process of distributing information among peer groups. For example, John visits a cardiovascular clinic frequently. The majority of patients exhibiting this behavior have the same underlying condition, e.g. chronic high blood pressure. To build a next-level prognostic AI model, we need not just John’s individual information. We also need a refined understanding of his relation to the peer group.
Message passing achieves this by comparing individuals’ details to those of their peer group. In the process, patients’ properties are updated to more closely resemble those of their peers. Note that in the clinic visits example, cohorts combine insights from all three tables: the patient table to identify underlying health conditions; the clinics table to recognize clinic specialities; and the visits table to determine behavioral patterns, like visit frequency.
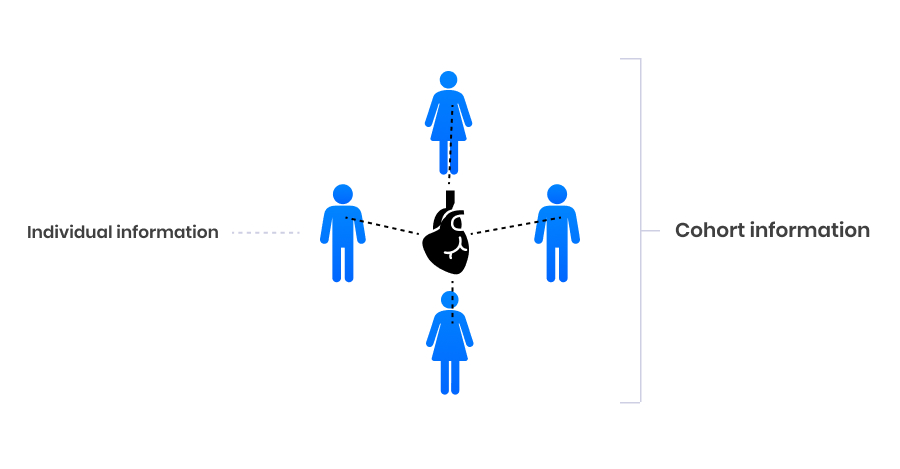 Through message passing, information on the individual and cohort level is combined for nuanced insights.
Aindo’s innovative approach to generating synthetic relational data is a combination of graph neural networks with deep generative models. By interpreting rows in tables as nodes and links between tables as edges, we first model relational databases as graphs.
We then combine message passing with generative AI. The message passing layer facilitates full use of cohort and patient-level insights. The generative AI component can then infer and replicate this information.
This innovative approach to synthetic relational data overcomes all the shortcomings of flattening:
Our approach was presented in the NeurIPS 2022 workshop on synthetic data. In the corresponding paper, we show that the method works well by testing it on two publicly available relational datasets.
In this blog, we introduced Aindo’s unique approach to creating realistic synthetic relational data.
In many practical cases, organizations deal with a great quantity of information stored in relational databases. Such databases consist of multiple interconnected tables. Each table contains information about a different aspect of the same problem.
Generating realistic synthetic relational data is challenging: realistic synthetic data should mirror not just the information contained in each table, but also the links between the tables.
The most common approach to creating synthetic relational data is through a technique called flattening: this means merging the various tables. Unfortunately, this approach does not explore connections between entities in different tables; it does not apply to relational databases with highly complex interconnections; and it requires processing redundant information, which leads to long computation times.
Therefore, Aindo has developed a groundbreaking technology for generating realistic synthetic relational data: a combination of graph neural networks and deep generative models. We model relational databases as graphs and apply graph neural network components to unveil cohort patterns. We then build synthetic data through a generative AI component. The combination of these components allows for the construction of synthetic relational data preserving inter- and intra-table patterns. Our innovative approach to synthetic relational data overcomes all the shortcomings of flattening.
Italian Patent No. 102021000008552; ↩
Why synthetic data represents a technological key to enable the secondary use of clinical data in Italian healthcare and accelerate medical research today.

How synthetic data is becoming the foundation for clinical evidence generation and specialized AI development

Synthetic data is not just a privacy tool. It is the foundation of a new healthcare data infrastructure—one that makes data usable at scale.
What we look for
Beyond your technical background, we look for:
What we offer
💡 Growth & Impact: join a fast-growing company where you’ll lead strategic projects, shape solutions and see the tangible impact of your work
🌴 Flexibility & Wellbeing: hybrid or fully remote work, ticket restaurant and health insurance
🤝 Collaborative Culture: work in autonomous teams with highly talented colleagues, in a supportive, innovative and ethical environment
How to apply
To apply, please send your CV and a motivation letter to [email protected], with the subject “Spontaneous Application - [Your Area of Expertise]”.
Aindo is an Equal Opportunity-Affirmative Action Employer – Minority / Female / Disability / Veteran / Gender Identity / Sexual Orientation / Age.